Django admin dashboard with Suit and Highcharts
One day my boss said "I want to see some statistical data about the users". I immediately thought about adding a custom page in the admin panel instead of creating a new view with admin restriction. I was already using django-suit which is a great theme (and more) for the Django admin panel, so I searched for a way to add a custom view within Suit. Looking at the issue from brunocascio on the repo, I found the comment written by rouxxx and linking to this post about django dashboard. I had then all I needed to start a proof of concept.
Contents
- Step 1: set up the files
- Step 2: activate your brand new dashboard
- Step 3: Highcharts!
- More customization
- The app I wrote using this
Step 1: set up the files¤
First, create a new app within your Django project:
./manage.py startapp dashboard
Then create the additional sites.py module in the new dashboard app.
# -*- coding: utf-8 -*-

from __future__ import unicode_literals
from django.contrib.admin.sites import AdminSite
from django.conf.urls import url
from dashboard.views import DashboardMainView


class AdminMixin(object):
    """Mixin for AdminSite to allow custom dashboard views."""

    def get_urls(self):
        """Add dashboard view to admin urlconf."""
        urls = super(AdminMixin, self).get_urls()
        del urls[0]
        custom_url = [
            url(r"^$", self.admin_view(DashboardMainView.as_view()), name="index")
        ]

        return custom_url + urls


class DashboardSite(AdminMixin, AdminSite):
    """
    A Django AdminSite with the AdminMixin to allow registering custom
    dashboard view.
    """
Next, update the contents of views.py:
# -*- coding: utf-8 -*-

from __future__ import unicode_literals
from django.views.generic import TemplateView


class DashboardMainView(TemplateView):
    template_name = "dashboard/main.html"

    def get(self, request, *args, **kwargs):
        context = self.get_context_data(**kwargs)
        return self.render_to_response(context=context)
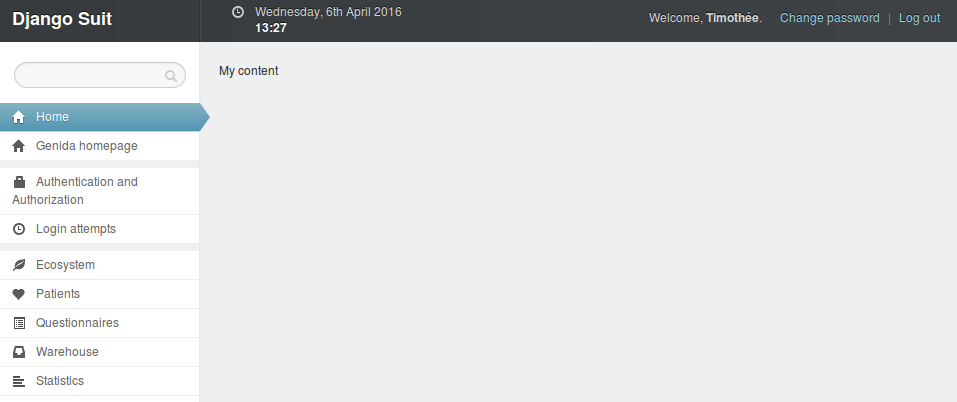
And finally, create the template main.html (thanks brunocascio):
{% extends "admin/base_site.html" %}
{% load i18n admin_static %}

{% block title %}
  My title
{% endblock %}

{% block breadcrumbs %}{% endblock %}
{#{% block sidebar %}{% endblock %}#}
{#{% block header_time %}{% endblock %}#}

{% block content %}
  My content
{% endblock %}
Step 2: activate your brand new dashboard¤
Add your dashboard app in your settings.INSTALLED_APPS, but also replace django.contrib.admin by django.contrib.admin.apps.SimpleAdminConfig (thanks rouxxx):
INSTALLED_APPS = (
    "suit",  # Beautiful admin interface
    # Replace 'django.contrib.admin' for dashboard
    # 'django.contrib.admin',
    "django.contrib.admin.apps.SimpleAdminConfig",
    # ...
    "dashboard",
    # ...
)
In your main urls.py, you can now use your custom AdminSite:
from dashboard.sites import DashboardSite

admin.site = DashboardSite()
admin.autodiscover()
EDIT: with Django 1.9.5, you will need one more line:\ (See Gustavo's comment in the comments section.)
admin.site = DashboardSite()
admin.sites.site = admin.site
admin.autodiscover()
Your urlpatterns should not be subject to change:
urlpatterns = [
    url(r"^admin/", include(admin.site.urls)),
    # ...
]
That's it, go check your new empty dashboard!
Step 3: Highcharts!¤
I was already familiar with Highcharts since I use it in my project, so it made sense to use it in the admin dashboard too.
Somewhere in your project, you will have functions that compute or retrieve data from your database(s) or else. Add these data in the context dictionary of the DashboardMainView in dashboard/views.py.
Example:
from core.data import get_country_name_by_code
from statistics.sitewide import nb_patients_per_country


class DashboardMainView(TemplateView):
    template_name = "dashboard/main.html"

    def get(self, request, *args, **kwargs):
        context = self.get_context_data(**kwargs)
        context["nb_patients_per_country"] = sorted(
            [
                {"country": get_country_name_by_code(k), "patients": v}
                for k, v in nb_patients_per_country().items()
                if v > 0
            ],
            key=lambda x: x["patients"],
            reverse=True,
        )

        # I filtered the 0 values out, and used get_country_name_by_code to
        # have the countries names translated!

        return self.render_to_response(context=context)
Then in your template, add links to Highchart, and use the previous data to create, for example, a pie chart:
{% block content %}
  <script src="http://code.highcharts.com/highcharts.js"></script>
  <script src="http://code.highcharts.com/highcharts-more.js"></script>
  <script src="http://code.highcharts.com/modules/exporting.js"></script>

  <div id="highchart-0"></div>

  <script type='text/javascript'>
    var dataset;

    dataset = {
      "chart": {
        "type": "pie",
        "plotBackgroundColor": null,
        "plotBorderWidth": null,
        "plotShadow": false
      },

      "title": {
        "text": "{% trans "Number of patients per country" %}"
      },

      "series": [{
        "name": "Countries",
        "colorByPoint": true,
        "data": [
          {% for tuple in nb_patients_per_country %}
            { "name": "{{ tuple.country }}", "y": {{ tuple.patients }} },
          {% endfor %}
        ]
      }],

      "tooltip": {
        "formatter": function() {
          return this.y + '/' + this.total + ' (' + Highcharts.numberFormat(this.percentage, 1) + '%)';
        }
      },

      "plotOptions": {
        "pie": {
          "showInLegend": true,
          "allowPointSelect": true,
          "cursor": "pointer",
          "dataLabels": {
            "enabled": true,
            "format": "<b>{point.name}</b>: {point.percentage:.1f} %"
            "style": {
              "color": function() {
                return (Highcharts.theme && Highcharts.theme.contrastTextColor) || 'black'
              }
            }
          }
        }
      }
    };

    $('#highchart-0').highcharts(dataset);
  </script>
{% endblock %}
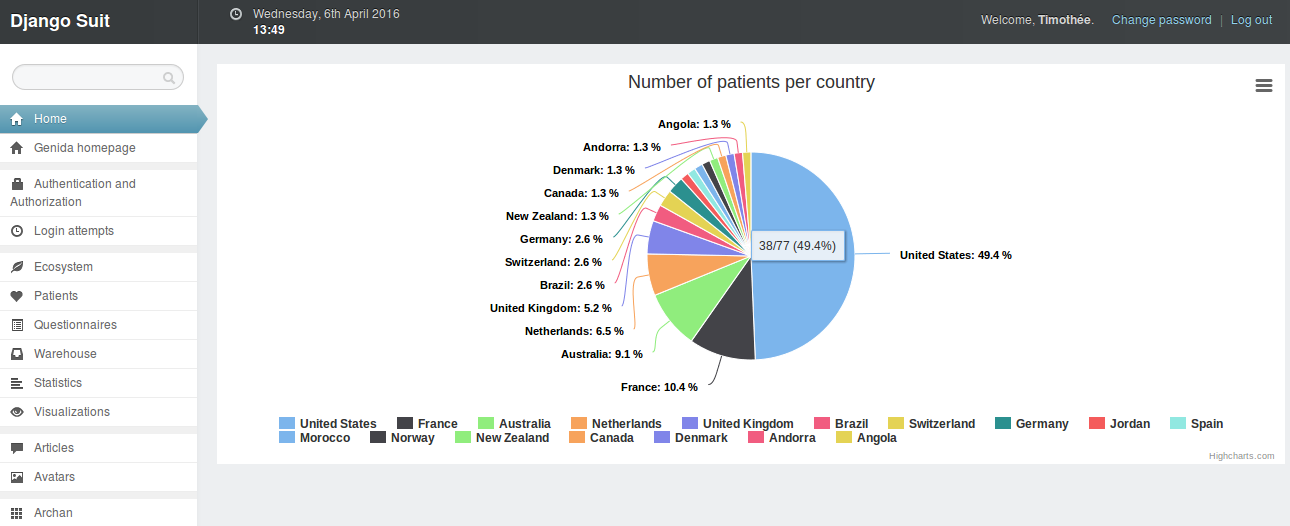
Here is the result:

For other types of chart, go check the Highcharts demos and their excellent API documentation!
More customization¤
Customizable contents¤
Columns¤
If like me you would like to use columns in the dashboard, you will be disappointed since we cannot use Bootstrap's column classes (col-md and stuff) for I don't know what reason. Instead, Suit provides the suit-column class which lets you stack multiple columns on one row. But you can't specify the width and they won't have the same size. Here is a CSS starting point to poorly imitate Bootstrap's columns:
.suit-row-1-col .suit-column {
    width: 100%;
}

.suit-row-2-col .suit-column {
    width: 50%;
}

.suit-row-3-col .suit-column {
    width: 33.33%;
}

.suit-row-4-col .suit-column {
    width: 25%;
}

.suit-row-5-col .suit-column {
    width: 20%;
}

.suit-row-6-col .suit-column {
    width: 16.66%;
}

.suit-row-7-col .suit-column {
    width: 14.28%;
}

.suit-row-8-col .suit-column {
    width: 12.5%;
}

.suit-row-9-col .suit-column {
    width: 11.11%;
}

.suit-row-10-col .suit-column {
    width: 10%;
}

.suit-row-11-col .suit-column {
    width: 9.09%;
}

.suit-row-12-col .suit-column {
    width: 8.333%;
}
...to use like this:
<div class="suit-row suit-row-3-col">
  <div class="suit-column">
    <p>1</p>
  </div>
  <div class="suit-column">
    <p>2</p>
  </div>
  <div class="suit-column">
    <p>3</p>
  </div>
</div>
...and which results like this:
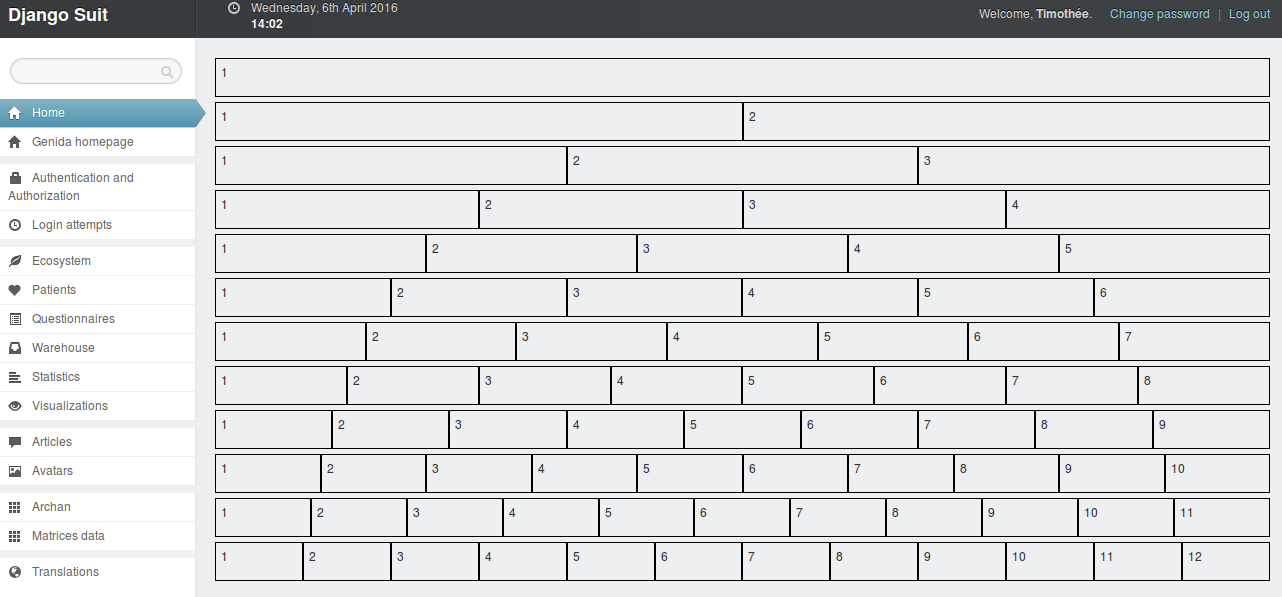
But this tweak is very limited because you can't have columns with different sizes on the same row...
More dashboard pages¤
Just add your additional URLs in dashboard.sites.AdminMixin (they should maybe be added at the end of the original URLs: return custom_url + urls + additional_urls), create the views and the templates and it's done.
Django Suit Dashboard¤
I wrote a Django app to do this: django-suit-dashboard. Go take a look! (and please keep in mind it's just a beta and it could/will be improved).